tribsantos

my personal opinions on policy matters

“Neoliberalism” has not been oversold

Over at the Finance and Development Jonathan Ostry, Prakash Loungani and Davide Furceri asking if neoliberalism has been oversold, and implying that it has. It has not, however, and if the IMF, of all institutions, starts arguing otherwise, people will be even less willing to buy it than they are now. Because that is the implication when you say something has been oversold: someone has got to be overbuying it for their own good. But most countries, developed and developing, could benefit from more neo or just plain liberalism.

For starters, we should define what neoliberalism is. This is the kind of word that is only ever used when people are criticizing a position – kind of like calling someone pro-abortion. It is a vague term which is only used when you think you found a flaw in arguably or real pro-market policies. The charitable view, however, is that they mean the Washington Consensus, a set of policies that John Williamson, an English economist, argued everyone who was anyone in DC defended. Importantly, these policies are very well-defined, as Williamson himself outlined them in a paper. They are (and I’m copying and pasting from Wikipedia here):

  1. Fiscal policy discipline, with avoidance of large fiscal deficits relative to GDP;
  2. Redirection of public spending from subsidies (“especially indiscriminate subsidies”) toward broad-based provision of key pro-growth, pro-poor services like primary education, primary health care and infrastructure investment;
  3. Tax reform, broadening the tax base and adopting moderate marginal tax rates;
  4. Interest rates that are market determined and positive (but moderate) in real terms;
  5. Competitive exchange rates;
  6. Trade liberalization: liberalization of imports, with particular emphasis on elimination of quantitative restrictions (licensing, etc.); any trade protection to be provided by low and relatively uniform tariffs;
  7. Liberalization of inward foreign direct investment;
  8. Privatization of state enterprises;
  9. Deregulation: abolition of regulations that impede market entry or restrict competition, except for those justified on safety, environmental and consumer protection grounds, and prudential oversight of financial institutions;
  10. Legal security for property rights

Number 1 – Fiscal policy. The authors indeed mention keeping deficits small relative to GDP as a potentially harmful policy. Notably, they specifically mention that the kind of discipline suggested by the consensus – avoidance of a large debt to GDP ratio – does not have very clear positive effects on growth and may increase inequality. Let’s take that as a given and say that the Washington Consensus got that wrong. How about the other recommendations? Have countries been too eager to follow this advice and are now in a bad situation? No.

The nine remaining recommendations are still the main challenge that countries still face. I will focus on Brazil which is the country I know better. If spending in education and health has improved significantly, this has been due mainly to an expansion of the state. Subsidies have not fallen; quite the contrary. Has there been a significant tax reform? No. Tax codes are distortionary and labyrinthine. Is there enough infrastructure spending? You can bet there is not.  Are interest rates determined by the market? Not always. Competitive exchange rates? Nope. Has the state implemented a large privatization program? Only a partial one. Has there been proper deregulation?  No. Legal security for property rights? Not enough.

These policies would still be part of the vast majority of mainstream economist’s recommendations. It is worth noting that not even Williamson, back in the day, was a staunch advocate for short-term capital flows. He defended the liberalization of inward foreign direct investments, just as Ostry, Lougani and Furceri do.

The post in and of itself is a sober critique of some policies. It is entirely possible that Ostry, Lougani and Furceri don’t even agree with the title of their post. It is common for editors to write attention-grabbing titles which earn many clicks, whatever is actually argued in the text. If that is the case, whoever wrote the title overplayed their hand.
Could self-driving cars solve rush hours?

People on twitter were arguing that cities should not plan for when self-driving cars arrive because they would not solve peak demand. I tried arguing that even if they do not solve peak demand there might still be a bunch of reasons why cities would like to plan ahead for a transformative technology. But I think that they could very well solve peak demand. It all depends on what numbers you think are reasonable. Here are mine (which I think are conservative).

The most inefficient scenario is if each person has rides in their own self-driving car. Conveniently for me, this is probably the easiest case to calculate too. Supposing each person will go to work in their own self-driving car, cars could be very small. Congestion prices based on the amount of space occupied (here’s a planning issue already) would create proper incentives. I’ll say 1m x 1m, which is plenty of space for a person to sit down and be comfortable. Engine could be below them, technology above.

If there are only self-driving cars, even if they were not be attached to one another, they could still be much, much closer then cars today. I say 50 cm to the sides and 2 m cm from the car ahead/behind. With this I am thinking that they are usually only 1 m apart, but that space must often be made for lane shifts.

How many cars can fit the streets of New York this way? The total length of the streets is 508.38 miles or 820 km. If there was just one lane, there could be 820,000/3 = 273,000 cars in the streets of New York. What is the average width of roads? New York avenues are pretty wide , but streets much less so. There’s a lot of parking space which, if there were a switch to self-driving cars only, could go away, so even a narrow street could have three lanes. So I will say that there is, on average, three lanes in the streets and avenues of New York. Since each lane is 12′ (3.7 meters) , we have an average street width of 11.1 meters, where one can fit 7 cars with 1 m width, 50 cm apart.

So we have 273,000 * 7 = 1,911,000. That’s how many of these cars, at these distances, fit in the streets of New York at any given moment. For how long would cars be on the streets for a person to get to work? I am assuming an average commute of 5 km. I am also assuming that these cars would be able to travel at an average speed of 15km/h (~10mph). This could sound high to you in light of crossings, but I don’t think it should, since one of the great advantages of self-driving cars would be to rationalize crossings, with every car moving at exactly the time that the light goes green. Since these will be electric cars, which accelerate pretty fast, they would most of the time travel at the average speed of 30 km/h (~19 mph). If they spend one minute at a traffic light for every minute they are driving, then they travel at 15 km/h.

Traveling 5 km at 15 km/h means you are there in 20 minutes. So, on average, every twenty minutes, 1,911,000 will cross the streets of New York and get to their destination, opening up space for other cars. In one hour, we would have 3*1,911,000 = 5,733,000 people reaching their destination, on a commute which would take only 20 minutes on average, door to door.

How good are these numbers? They are pretty good. They are actually extremely close to the total daily ridership of the New York subway system, which, according to Wikipedia, was 5,597,551 in 2014. In the worst case scenario for self-driving cars, we would assume that all of these trips happen at peak demand hours, and there are only two hours which are peak during a day – one in the morning, one at night. Even then, self-driving cars would be twice as effective as the busiest subway system in the West.

But capacity would probably be even larger. Congestion charges would create incentives for people to fit in the smallest space possible. I would just get my phone and say where I wanted to go and some app would show five other people very close to me who also wanted to go somewhere very close to where I was going to. If it was a concert or a game, whole buses could be easily filled with people going to close places.

If this is going to happen, however, there are some key actions that governments will have to take – most importantly, charge adequate and proportional prices for street use. So it is something that local governments most definitely should be talking about.


A recommendation is not an order

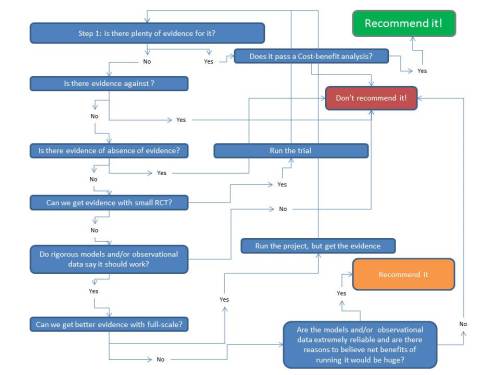
Kirsty Newman was very nice to answer this post  in which I bring my very own evidence-based policy flowchart®. She even said she liked it. However, there seems to be two objections.  She says – correctly – that much of policy making involves personal views, politics etc, which are the factors that ultimately decide what policies should be implemented or not. But the flowchart talks about recommendations of policies, not decisions. The second objection is that it would not apply to many situations but only a very specific subset of policies.

There is an important difference regarding the first objection. It is true that democracy presupposes that experts won’t decide everything according to their own beliefs and priorities. The people have ultimate sovereignty over decisions. Politicians, being representatives of the people, have ultimate power over experts. That’s how things are and – in the humble opinion of this intermittent blogger – that’s how they should be.

But experts are called upon by democracies to give their, well, expert opinions. And that should not be confused with the opinion that the people or the politician already have and think the expert should share. This is why all of the paths of the flowchart end in a recommendation, not a decision. Too often, however, experts seem to take into account political factors to make a recommendation, and then politicians and the public use those recommendations to form their preferences about policies and a vicious circle is formed. So I still do not see anything wrong with the flowchart.

Maybe an analogy will make my point clearer. Suppose you are a patent lawyer, and an inventor comes to you and says he wants to apply for a patent on what effectively is a car, telling you how certain he is that the patent will be granted because it is such a novel and non-obvious idea. You have the duty of telling him that his chances of getting the patent are very slim. Suppose, on the other hand, that he says: “I don’t care what you think my chances of getting a patent on my invention, I’m asking for your expertise on how to produce patent applications and you let me worry about my odds”. I would be perfectly fine doing that job.

With regard to it being applicable to only a very specific subset of policies, I don’t see why would that be the case. Blame it on my limited imagination, but I can’t think of an example of a policy where that flowchart would not be applicable – with the important caveat that, as said above, it concerns only recommendations, not decisions.

Let’s use, as an example, GiveWell recent discussion of taxes on alcohol. This is the kind of policy issue that I can envision some people not wanting to use the flowchart. But let’s apply it, then. Is there plenty of evidence that the policy would be beneficial? I hardly think so. For one, there are a number of studies indicating benefits of alcohol consumption, which might even be large. Now these are observational studies, and they have the issues that observational studies often have. So while I would not count that there is plenty of evidence for it, I would not say there is plenty of evidence against it.

The next step would be harder. Can we get evidence with an RCT? It would take a long time. So both “yes” – in the future – and “no” – right now – are valid answers. So let us go with “no”, because if we answer yes everything would be simple.

We would then ask ourselves: can we get the evidence if we run the full project (in this case, establish the tax)? We sure can. We could, after establishing the tax, randomize a few not to be affected by it and even establish some kind of compensation for them to participate in the project. Considering the potential net benefits for the whole world of getting this policy right, this compensation could even be pretty large.

The reason I think this flowchart can be applied across the board is that it has a clear answer for when there are not clear answers: don’t do anything. Policies involve limiting people’s activities, so we should only implement them when we have very good reason to think they are actually going to work.

Can you think of a counterexample where the flowchart would not apply? I would like to hear about it.

What do you disagree with on this flowchart?

I sometimes have a really hard time understanding exactly where I disagree (if I do disagree) with people regarding evidence-based policy. Kirsty Newman, for example, has some posts about how a nuanced view of evidence-based policy is necessary. Many people actually prefer the idea of evidence-informed policies and others still – Bill Easterly is a prominent example – think that experts are actually tyrants. Being myself an enthusiast of evidence-based policy, I came up with this flowchart which translates my understanding of how things should be. Being not completely sure about what the more nuanced view is, I am very curious to understand where people differ. (click the image to enlarge)

ebp flowchart


(Maybe ) you can reform your way to growth

Dietz Vollrath has a post doubting John Cochrane’s defense of the possibility of 4% growth. Vollrath’s argument is that  even a “massive” increase in potential GDP would only increase growth by some 0.4 percentage points, so that growth would only be 3.3%. The problem with the argument is that it assumes what it is trying to prove. How do we know if an increase in potential GDP of 18% is massive? We hardly ever think in terms of potential GDP, which makes it very hard to think intuitively about what is a realistic change and what is not. Growth, on the other hand, is something we are used to thinking about everyday, and as Cochrane points out, there have been several instances of 4% GDP growth at different times in US history, so that should give some idea about what is massive after all.

Vollrath argues that the US does not have room for the kind of change seen in China after reforms. I agree and I suspect that Cochrane would agree too. But China has not been growing 4% a year. It has been growing at an average of almost 10% for 25 years. Plugging in the numbers in Vollrath’s own formula, we have that reforms in China increased potential GDP by 4.5 times! That is 9 times the increase suggested by Cochrane – and by Vollrath’s own account the change was achieved by reform.

If we look at a list of countries by GDP per capita PPP (and assume that on average countries are at their potential) we are reminded of how wildly per capita gdp may vary. Singapore’s income is 130 times the income of the Central African Republic and more than five times the world average. Now you might argue that I’m not making a fair comparison by comparing the US with Singapore or the CAF – it would be better to compare the US with its peers. But that would be a circular argument. Of course the US has income very close to that of its peers, that’s what makes them peers.

Also, the US has policies that closely resembles that of its peers. Most notably, none of the countries in Europe – the usual suspects for comparison – adopts policies that come anywhere close to the level of economic liberalization that Cochrane suggests. In fact, I can think of only one country that is somewhat similar to the one suggested by his blog post: Singapore. Their income per capita? 82k or 151% that of the US. That’s awfully close to the 53% increase in potential GDP which would be required for the US to achieve 4% growth. This is what I call a funny coincidence.

What if every aid conversation did begin with “is it better than cash”?

Chris Blattman points to an article in Aid Thoughts on whether there is a risk that talk about cash transfers may be dominating discourse on aid and development. While the author in Aid Thoughts is an enthusiast of transfers, he fears that an obsession with it may divert attention from good but hard to evaluate interventions, like big infrastructure projects. His conclusion is that “we should be cautious not to use cash transfers as the appropriate gold standard for every intervention. There are plenty of public-good-type interventions which are (currently) hard-to-measure but important. Whether or not aid donors and governments are any good at funding these interventions should be the starting point for the discussion”.

But what if we are being too cautious? The evidence in favor of cash transfers is building through the years. The same cannot be said of other ideas. However, the money dedicated to cash transfers is but a fraction of the whole aid money and, more importantly, a tiny part of what it could be.

There are billions of poor people in the world. We want to help them. We have two idealized options (and combinations of that): we can use the money in something we know works or we can use it on something that might work. Why would we not invest at least the great majority of our resources in the thing we do know works? Surely, innovation is important, moonshots are great, Google gives employees 20% of their time to invest in things that may not be very structured. But that is not the kind of arrangement we now have in development. What we have is comparable to Google employees working only 5% (or a more precise number, if you can provide me) to the core business. That is no way to run a business, and that’s no way to achieve any goal.

Also, it is not a zero-sum situation. We tend to think of development money as a fixed value. If we use more on transfers, we use less on other enterprises. But we should think that the current equilibrium is achieved with widespread skepticism about the effectiveness of aid. I don’t think it is necessary to draw demand and supply curves to show that in the presence of considerable uncertainty over achieving a certain goal, the amount of resources directed at achieving that goal will be much less than with much more certainty. Which means that evidence-based aid should translate to many more resources invested.

So I say, let’s keep asking “is it better than cash?”. Not because other ideas are not good. But because cash is very, very good.